

How Your Car's MPG And Greenhouse Gas Emissions Are Related, According To The EPA
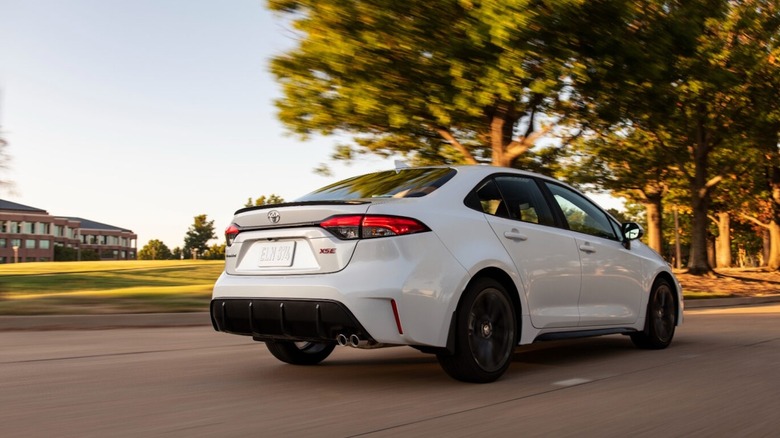
As far as the Environmental Protection Agency (EPA) is concerned, how much a car pollutes and how much gas it consumes are directly related. But to understand this fully, you have to understand the agency's vernacular. Miles per gallon (MPG) seems intuitive. How far you can go on a gallon of fuel, right? Yes. However, there's an inherent flaw in MPG we'll dig into below.
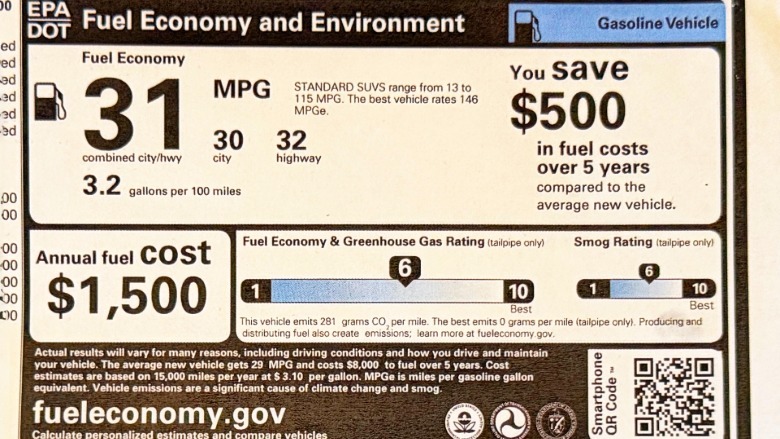
Regarding greenhouse gas emissions, or GGE, this is also fairly simple. It's a rating of CO2 grams produced per mile of travel. Eyeball the window sticker for a 2026 Kia Telluride below, and you'll see that it seems pretty good on a scale of 1-10. A rating of six (for a 2025 model or newer) means you're sending out 266-323 grams of CO2 per mile. Worst on this scale, a one, means spewing at least 659 grams of CO2 per mile, while best, a 10, sits at 0-74 grams per mile. Arguably, the EPA could make it more obvious that 659 is, uh, 659 times as icky as 0, but we're reporting this as Trump's EPA tries to make cars less efficient, so good luck with clearer messaging.
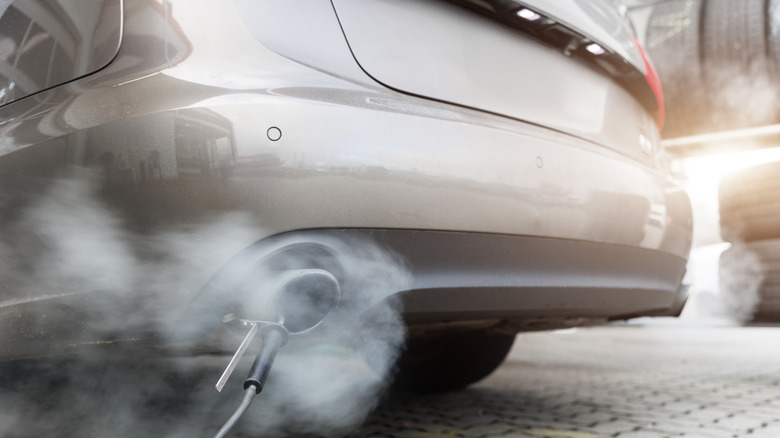
The EPA arrived at its rating system in the 1970s using what's known as the carbon balance method. Simply put, according to the EPA, carbon burned is directly related to the amount of fuel consumed. And when you capture emissions, you can calculate the exact volume of fuel burned and the amount of carbon produced, and easily deduce both fuel economy and CO2 emissions. Also, it's cheaper than separate testing and can be performed on an automotive treadmill that can simulate wind and road friction. Did we mention that the agency proved this M.O. by evaluating a 1976 Mercury Montego? Of course it did.
Why lab testing, not road testing is superior.
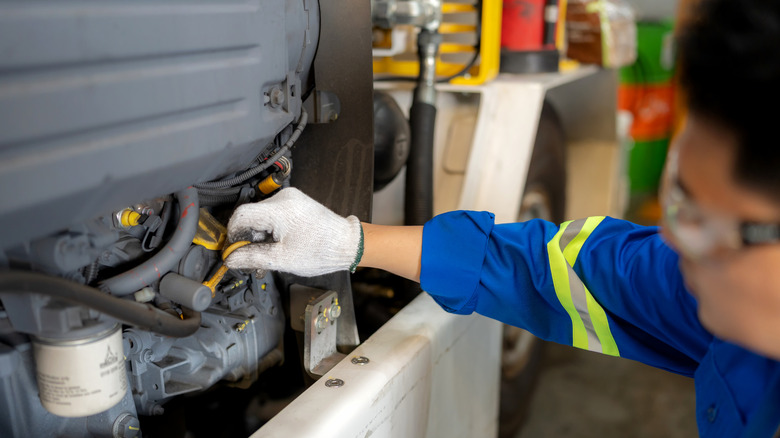
To back up, the EPA doesn't test every car each model year. The agency tests only about 10-15% of models, and carmakers certify their own cars using the same methodology set by the EPA.As for how it works, it consists of five parts, three of which were added in the 2008 model year, after consistent complaints that EPA estimates were overly generous. These include a city cycle run at a pokey 21.2 mph; a highway element at 48.3 mph; and the newer, harder benchmarks including a higher-speed test that simulates harder acceleration and speeds up to 80 mph; plus an evaluation measuring more A/C use with the lab thermostat cranked to 95 degrees, and a cold-weather city cycle where they chill the room to 20 degrees. Another important and delicate factor to consider is the purity of fuel, which, you can understand, will impact both the perceived efficiency of an engine and its emissions, which is why the EPA uses specially formulated gas so that every car is burning as near as possible identical fuel.
Arguably, lab versus real-world testing comes down to measurements that are controllable and repeatable. Driving on a test track would introduce wind and temperature variables that would make a hash of results, and you'd never have fair comparison data. And the EPA has a team of technician-drivers who know how to mirror every test as identically as possible.
The math is harder to math than in other countries.
We know what you're thinking: Who cares that the EPA thinks about emissions and fuel economy as a consistent relationship? I want to know why their fuel-economy numbers don't always match reality. Partly, that's because you don't drive in a laboratory. The EPA's testing doesn't measure, say, driving on very hilly terrain, speeding, or aggressive stops and starts — which they encourage you not to do. They also say factors like underinflated tire pressure will directly impact mileage, and don't forget that temperature impacts tire PSI.
But there's another factor that has nothing to do with the EPA's math: gallons-per-mile might be the wrong formula. Researchers at Duke University argue that the system used in the European Union, which is liters per 100 kilometers, is smarter. They argue this comes closer to visualizing and deducing actual efficiency jumps and dollars spent. Their table shows that even though improving from 16.5 MPG to 20 MPG is a 20% gain in fuel economy and from 33 to 50 MPG is a 50% gain, both "improvements" only represent a reduction of 100 gallons used over 10,000 miles.
But if you can see that one car burns three gallons in 100 miles, and another burns six gallons in 100 miles, the numbers make for much easier math. And from there, you can also deduce the cost (duh, it's double, regardless of gas prices), and the GGE would be double as well. The EPA wouldn't have to change anything they do for testing, and everyone would understand the relationship between fuel economy and carbon emissions (and bucks burned) much more directly than a weird 1-10 score.